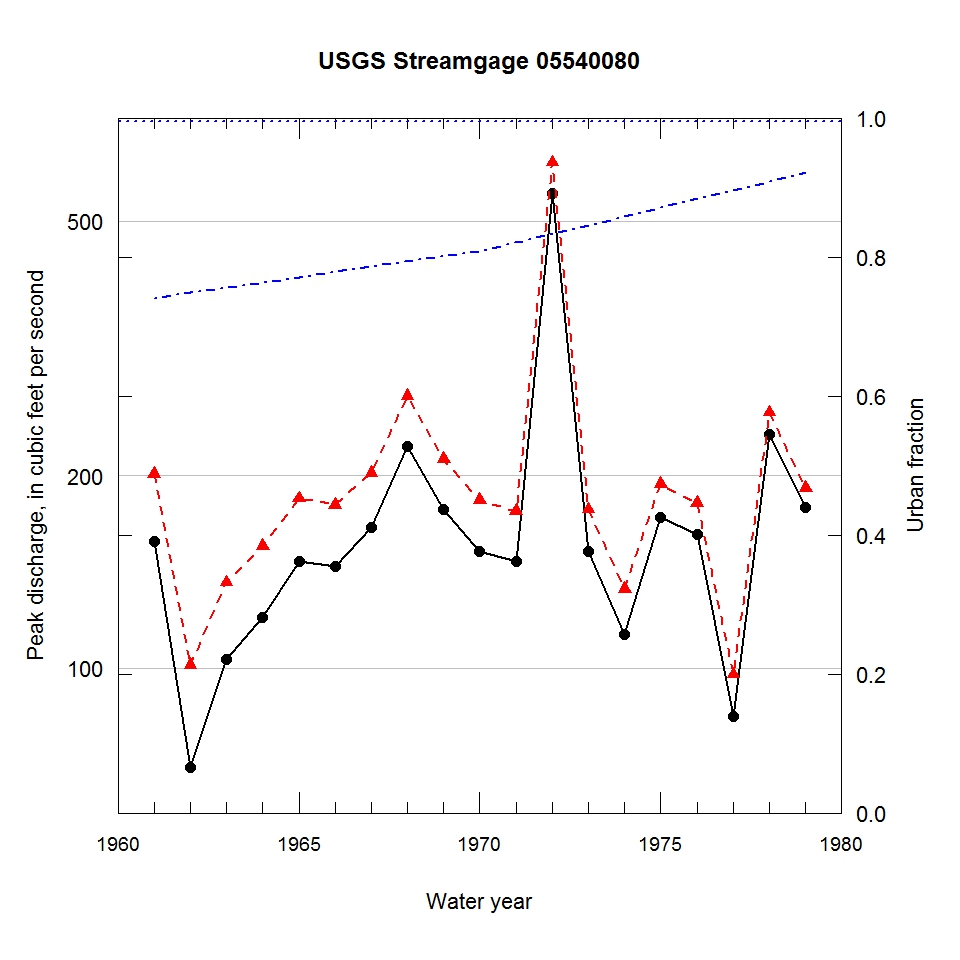
Observed and urbanization-adjusted annual maximum peak discharge and associated urban fraction and precipitation values at USGS streamgage:
05540080 SPRING BROOK AT WHEATON, IL


| Water year | Segment | Discharge code | Cumulative reservoir storage (acre-feet) | Urban fraction | Precipitation (inches) | Observed peak discharge (ft3/s) | Adjusted peak discharge (ft3/s) | Exceedance probability |
| 1961 | 1 | -- | 0 | 0.741 | 1.703 | 158 | 201 | 0.219 |
| 1962 | 1 | 2 | 0 | 0.749 | 0.303 | 70 | 101 | 0.870 |
| 1963 | 1 | -- | 0 | 0.756 | 1.850 | 103 | 136 | 0.620 |
| 1964 | 1 | -- | 0 | 0.764 | 3.628 | 120 | 155 | 0.491 |
| 1965 | 1 | -- | 0 | 0.771 | 1.729 | 147 | 184 | 0.296 |
| 1966 | 1 | -- | 0 | 0.779 | 1.973 | 144 | 180 | 0.325 |
| 1967 | 1 | -- | 0 | 0.786 | 1.635 | 166 | 202 | 0.215 |
| 1968 | 1 | -- | 0 | 0.794 | 3.492 | 222 | 266 | 0.083 |
| 1969 | 1 | -- | 0 | 0.801 | 1.479 | 177 | 212 | 0.187 |
| 1970 | 1 | -- | 0 | 0.809 | 1.274 | 152 | 183 | 0.299 |
| 1971 | 1 | -- | 0 | 0.821 | 1.081 | 147 | 176 | 0.350 |
| 1972 | 1 | -- | 0 | 0.834 | 4.240 | 552 | 617 | 0.004 |
| 1973 | 1 | -- | 0 | 0.846 | 1.764 | 152 | 177 | 0.342 |
| 1974 | 1 | -- | 0 | 0.859 | 0.589 | 113 | 133 | 0.648 |
| 1975 | 1 | -- | 0 | 0.871 | 1.567 | 172 | 194 | 0.246 |
| 1976 | 1 | -- | 0 | 0.884 | 1.241 | 162 | 181 | 0.311 |
| 1977 | 1 | -- | 0 | 0.896 | 2.289 | 84 | 98 | 0.889 |
| 1978 | 1 | -- | 0 | 0.909 | 2.013 | 232 | 251 | 0.106 |
| 1979 | 1 | -- | 0 | 0.921 | 1.427 | 178 | 191 | 0.257 |

